Wednesday, March 21, 2012
Donald Clark has started a blog marathon looking at a history of pedagogic practise. Its a self-selected list and will inevitably not include those you think it could or should….. but if you want to get a flavour and feel for the scope and extent then it makes fascinating reading. And in good academic style, there are plenty of references to follow up on.
A must read.
Hillier, J.K. and Smith, M.J. (2012)
Geomorphology

Metrics such as height and volume quantifying the 3D morphology of landforms are important observations that re?ect and constrain Earth surface processes. Errors in such measurements are, however, poorly under-stood. A novel approach, using statistically valid ’synthetic’ landscapes to quantify the errors is presented. The utility of the approach is illustrated using a case study of 184 drumlins observed in Scotland as quanti?ed from a Digital Elevation Model (DEM) by the ‘cookie cutter’ extraction method. To create the synthetic DEMs, observed drumlins were removed from the measured DEM and replaced by elongate 3D Gaussian ones of equivalent dimensions positioned randomly with respect to the ‘noise’ (e.g. trees) and regional trends (e.g. hills) that cause the errors. Then, errors in the cookie cutter extraction method were investigated by using it to quantify these ’synthetic’ drumlins, whose location and size is known. Thus, the approach deter-mines which key metrics are recovered accurately. For example, mean height of 6.8 m is recovered poorly at 12.5�0.6 (2s) m, but mean volume is recovered correctly. Additionally, quantification methods can be compared: A variant on the cookie cutter using an un-tensioned spline induced about twice (�1.79) as much error. Finally, a previously reportedly statistically significant (p=0.007) difference in mean volume between sub-populations of different ages, which may reflect formational processes, is demonstrated to be only 30-50% likely to exist in reality. Critically, the synthetic DEMs are demonstrated to realistically model parameter recovery, primarily because they are still almost entirely the original landscape. Results are insen-sitive to the exact method used to create the synthetic DEMs, and the approach could be readily adapted to assess a variety of landforms (e.g. craters, dunes and volcanoes).
Hooke, J.M. and Smith, M.J.
Scottish Geographical Journal
A project has been initiated that will produce an interactive website searchable by maps and database terms, aimed at increasing knowledge and awareness of the geodiversity, landforms and processes of Britain and Northern Ireland,. It has the following objectives: (1) to make existing knowledge on the physical landscape and geomorphology of Britain more widely accessible; (2) to increase knowledge and awareness of physical attributes of the landscape; (3) to provide a synthesis of present knowledge; (4) to identify gaps in present knowledge as a platform for future societally relevant research. The components and steps in the project are outlined.
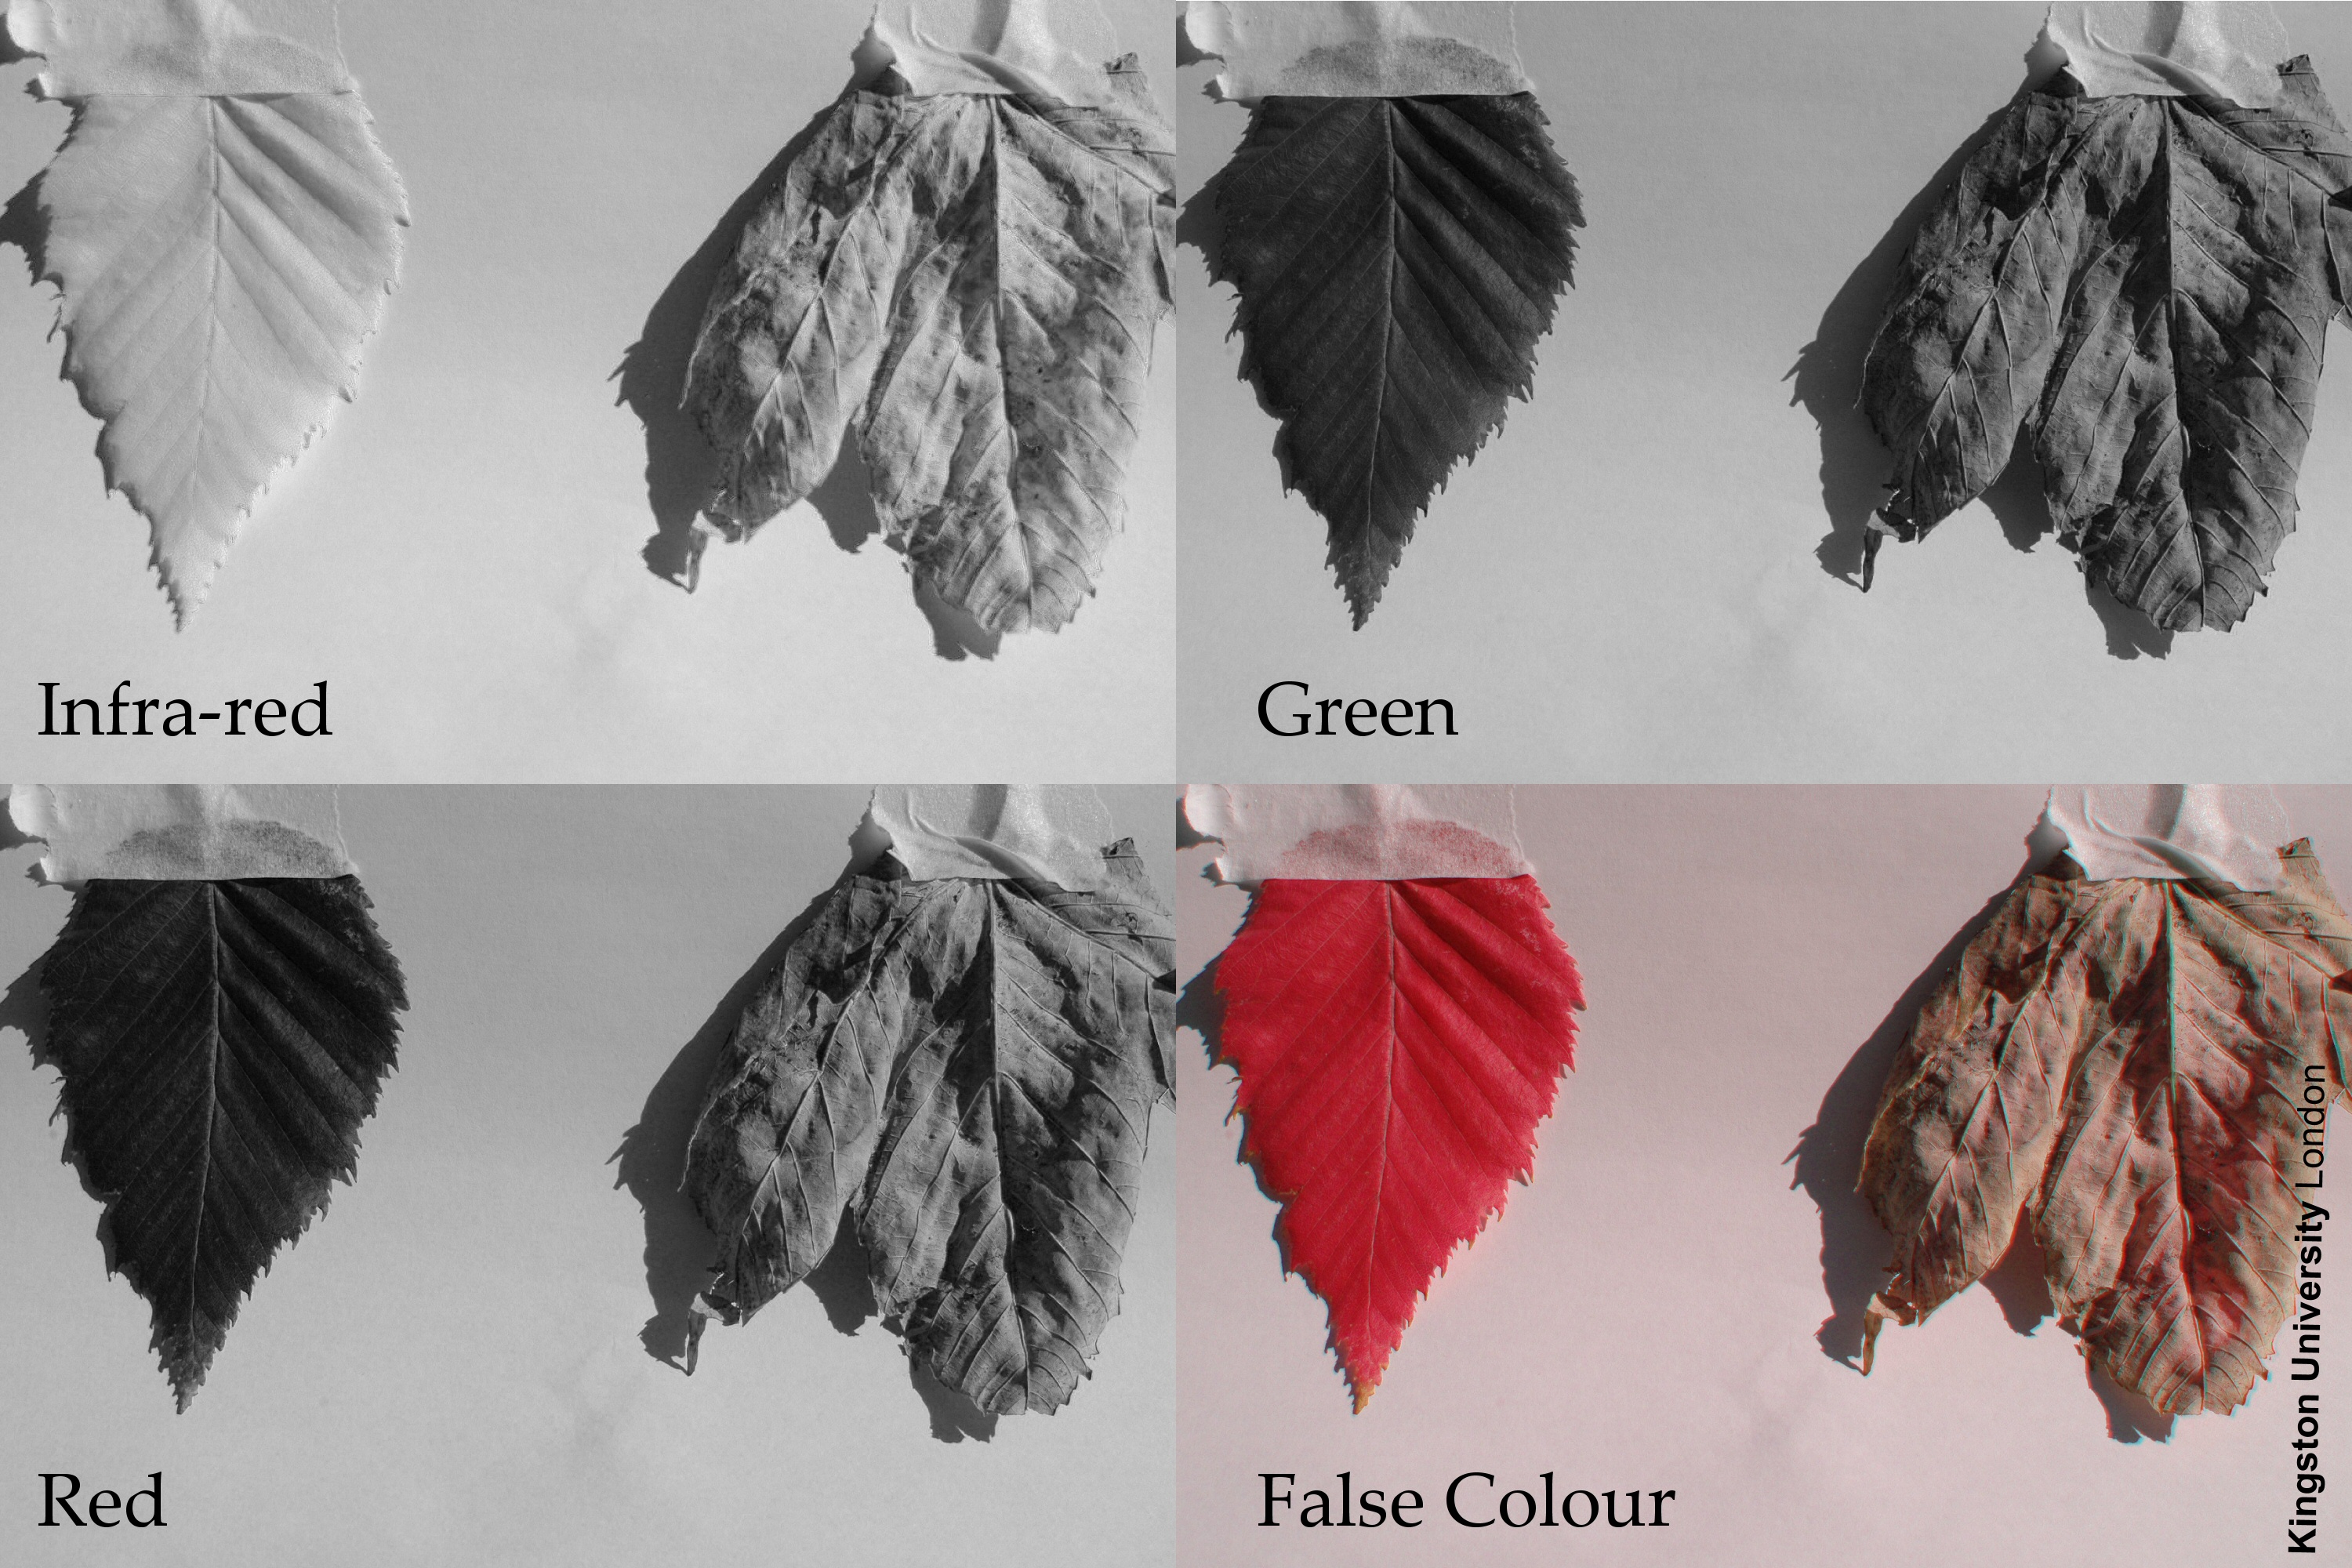
During my course on Remote Sensing last year I was trying to drive home to the students that EM radiation is comprised of different wavelengths and that Earth surface features reflect radiation very differently at different wavelengths. Vegetation is a nice example to use because of the dramatic change of reflectance from red to near infra-red (NIR). And you can show this even better by imaging vegetation they are familiar with.
Using my Nikon D70 which is particularly sensitive to NIR I photographed a dead leaf and live leaf in red, green and NIR (below). The postcard (click on it to get a hi-res version) shows each “band” as a greyscale image and you can clearly see the low reflectance in red and green and high reflectance (white) in NIR. The dead leaf still reflects more in NIR, but the difference is far less pronounced; indeed reflectance is nearly equal across all three bands which is why the leaf appears brown in the false-colour composite (bottom right) whilst the live leaf is red.

I blogged on Freemind, the open source mind mapping software, a few days ago, but wanted to add on to that post. The development team are reaching a v1.0 release candidate (currently in Beta) and have incorporated the ability to add location to nodes on your mind map. Tools -> Map (or Ctrl-Alt-M) brings up the Map window which loads OSM data of Europe. Type in the “Search Location” bar the place you want to add and hit enter. The location pointer is centred at this location. You can now:
- zoom in to look at this in more detail.
- move the point - or rather, single-click anywhere in the new window to place the pointer somewhere else
- click Actions -> Place Selected Nodes to add the location to you node
- double-click to place a new node in your mind map at that location
All very useful and interesting functions and good to see OSM integrating and enabling such a feature. It will be interesting to see how this develops.